Math Is Fun Forum
You are not logged in.
- Topics: Active | Unanswered
#1 2012-09-21 22:41:46

Plot functions defined on rational numbers and irrational numbers
Hi All,
Suppose f1, f2, and g are arbitrary functions of real variables.
Let
f(x) =
f1(x) if x is rational,
f2(x) if x is irrational.
What software can be used to define f(x) such that we can plot y = f(g(x)) directly?
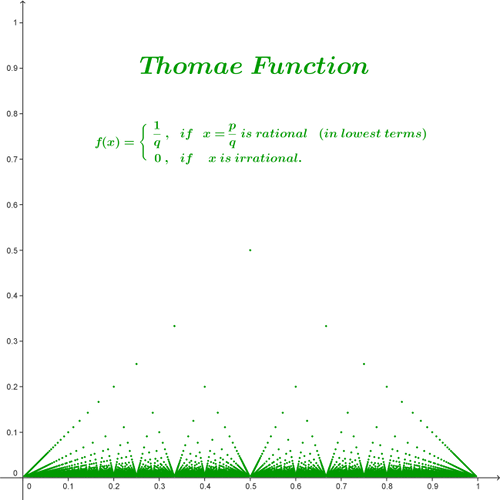
For example, consider the Thomae function:
f(x) =
1/q if x=p/q is rational, gcd(p,q)=1 and q>0,
0 if x is irrational.
How to define f as a function such that we can plot y = f(sin(x)) directly?
Offline
#2 2012-09-22 00:12:45
- bobbym
- bumpkin

- From: Bumpkinland
- Registered: 2009-04-12
- Posts: 109,606
Re: Plot functions defined on rational numbers and irrational numbers
Hi benice;
Looks like it is going to be tricky using the Dirichlet-Thomae function.
Just generating that function is a chore. The best solution I think is showed by J.M. over at the stackexchange. He generates lots of rationals using a farey sequence and then just plots them. See below first picture, it looks like yours.
How did you generate your points, did you use a farey sequence too?
Do you have a rationalize command in the language or grapher you are using? If you do then there is a way, see the second picture that is f(sin(x)), I think.
In mathematics, you don't understand things. You just get used to them.
If it ain't broke, fix it until it is.
Always satisfy the Prime Directive of getting the right answer above all else.
Offline
#3 2012-09-25 10:36:34
Re: Plot functions defined on rational numbers and irrational numbers
How did you generate your points, did you use a farey sequence too?
Hi,
I used the GeoGebra command 'Sequence' to generate those points:
Sequence[Sequence[(p/q,GCD[p,q]/q),p,1,q-1],q,2,300] .
Do you have a rationalize command in the language or grapher you are using? If you do then there is a way
I have downloaded Maxima 5.28 (which has a rationalize command), but I have no idea how to do that.
Yesterday, I constructed an approximate method which can plot the graph of y = f(sin(x)) directly.
( See this page for some examples. )
Thank you for your help bobbym!
Offline
#4 2012-09-25 11:44:40
- bobbym
- bumpkin
- From: Bumpkinland
- Registered: 2009-04-12
- Posts: 109,606
Re: Plot functions defined on rational numbers and irrational numbers
I have downloaded Maxima 5.28 (which has a rationalize command), but I have no idea how to do that.
The trick is to generate rationals. That is what Rationalize does.
1) Make a function called fubar in your language.
fubar[n_]:=Rationalize[Sin[x]] ( In mathematica )
2) Generate a sequence from 1/5000 to 1 with a step size of 1 /5000 using on fubar for each number.
3) Take the denominator of each of these numbers in the sequence and invert it. In other words 1 / denominator. That is how I generated the composition, f(g(x)).
In mathematics, you don't understand things. You just get used to them.
If it ain't broke, fix it until it is.
Always satisfy the Prime Directive of getting the right answer above all else.
Offline