Math Is Fun Forum
You are not logged in.
- Topics: Active | Unanswered
Pages: 1

#2 2011-07-04 17:11:45
- bobbym
- bumpkin

- From: Bumpkinland
- Registered: 2009-04-12
- Posts: 109,606
Re: Graphing implicit polar equation?
Hi benice;
Do you have an example?
In mathematics, you don't understand things. You just get used to them.
If it ain't broke, fix it until it is.
Always satisfy the Prime Directive of getting the right answer above all else.
Offline
#3 2011-07-05 11:43:19
Re: Graphing implicit polar equation?
Hi bobbym,
Thanks for your reply!
Please see the Equation Grapher examples with x & y replaced by r & t.
My purpose is to make art with implicit polar equations, not to solve a specific math problem.
It is better if the software can also plot inequalities of the following types:
f(r,t) > 0, f(r,t) >= 0, f(r,t) < 0, f(r,t) <= 0.
Someone recommended me Mathematica. But it's too expensive!.
Offline
#4 2011-07-05 15:03:14
- bobbym
- bumpkin
- From: Bumpkinland
- Registered: 2009-04-12
- Posts: 109,606
Re: Graphing implicit polar equation?
Hi benice;
examples with x & y replaced by r & t.
Not to confuse you but polar coordinates are not quite the same as replacing the rectangular coordinates x, y with r and t.
My purpose is to make art with implicit polar equations, not to solve a specific math problem.
In mathematics the terms polar and implicit have an exact meaning which is very likely different than what you mean. That is why I asked to see an equation you are trying to graph.
You are talking about art and I, hopefully about mathematics. We must speak the same language. You might be able to get away with just an implicit plotter.
Someone recommended me Mathematica. But it's too expensive!
Are you a student? If so the price is drastically reduced. There are freeware alternatives but like mathematica they can overwhelming if you are just a casual user.
I have been to your page and some of that looks to me like it could be done by an implicit rectangular plotter. There is one over here.
If you are using polar coordiantes I could do a transformation to rectangular coordinates then any old plotter could do them.
In mathematics, you don't understand things. You just get used to them.
If it ain't broke, fix it until it is.
Always satisfy the Prime Directive of getting the right answer above all else.
Offline
#5 2011-07-06 21:19:33
Re: Graphing implicit polar equation?
Hi bobbym,
Thanks for your kind reply!
Below is an example function
f(r,t) = sin(mr)*cos(nt - pi) - (3/4)*cos(kt - pi/2) - r³ + 3r - 3/4.
The plotter I use to experiment is Graph 4.3. It transforms the coordinates and then
plots implicit rectangular equations. The plotter works fine if n, k are integers or
rational numbers with small denominators.
The plotting speed is very slow if n, k are irrational numbers or rational numbers
with large denominators (e.g. k = 3/128). And this is why I am looking for a plotter
which can plot implicit polar equations directly and quickly.
m=8, n=6, k=5: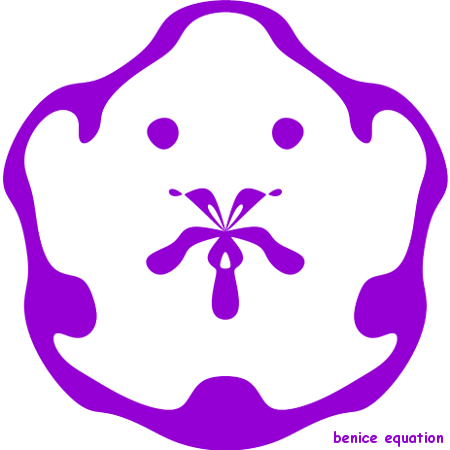
m=8, n=6, k=6: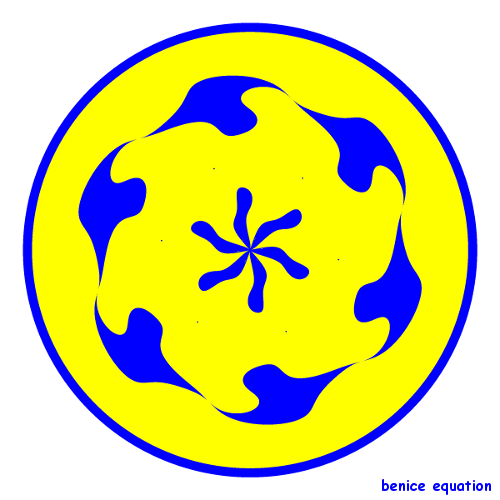
Offline
#6 2011-07-07 01:58:11
- bobbym
- bumpkin
- From: Bumpkinland
- Registered: 2009-04-12
- Posts: 109,606
Re: Graphing implicit polar equation?
Hi;
For the first one:
m=8, n=6, k=5:
What intervals do you use for r and t?
In mathematics, you don't understand things. You just get used to them.
If it ain't broke, fix it until it is.
Always satisfy the Prime Directive of getting the right answer above all else.
Offline
#8 2011-07-08 15:40:28
- bobbym
- bumpkin
- From: Bumpkinland
- Registered: 2009-04-12
- Posts: 109,606
Re: Graphing implicit polar equation?
Hi benice;
I have been able to plot those functions with just an implict grapher in rectangular coordinates ( x, y ). You will no longer need a polar plotter. This might speed things up a bit.
The strange thing is your two graphs seem backwards. The bottom one is for m=8, n=6, k=5. And the top one is for m=8, n=6, k=6.
In mathematics, you don't understand things. You just get used to them.
If it ain't broke, fix it until it is.
Always satisfy the Prime Directive of getting the right answer above all else.
Offline
#9 2011-07-08 16:55:16
Re: Graphing implicit polar equation?
The strange thing is your two graphs seem backwards. The bottom one is for m=8, n=6, k=5. And the top one is for m=8, n=6, k=6.
Sorry! The equation should be
f(r,t) = sin(mr)*cos(nt - pi) + (3/4)*cos(kt - pi/2) - r³ + 3r - 3/4,
not
f(r,t) = sin(mr)*cos(nt - pi) - (3/4)*cos(kt - pi/2) - r³ + 3r - 3/4.
Last edited by benice (2011-07-08 20:12:32)
Offline
#10 2011-07-08 20:16:00
- bobbym
- bumpkin
- From: Bumpkinland
- Registered: 2009-04-12
- Posts: 109,606
Re: Graphing implicit polar equation?
Hi
Oh no! I did not see your edit when I did this post here. I will rework the problem with the new equation.
In mathematics, you don't understand things. You just get used to them.
If it ain't broke, fix it until it is.
Always satisfy the Prime Directive of getting the right answer above all else.
Offline
#11 2011-07-08 21:43:48
Re: Graphing implicit polar equation?
Hi bobbym,
Here is what I use in the plotting process.
Define the following functions:
f0(x,y) = f( sqrt(x^2 + y^2), atan2(x,y) )
f1(x,y) = f( sqrt(x^2 + y^2), atan2(x,y) + 2*pi )
f2(x,y) = f( sqrt(x^2 + y^2), atan2(x,y) + 4*pi )
f3(x,y) = f( sqrt(x^2 + y^2), atan2(x,y) + 6*pi )
. . . . . .
g0(x,y) = f( -sqrt(x^2 + y^2), atan2(x,y) + pi )
g1(x,y) = f( -sqrt(x^2 + y^2), atan2(x,y) + 3*pi )
g2(x,y) = f( -sqrt(x^2 + y^2), atan2(x,y) + 5*pi )
g3(x,y) = f( -sqrt(x^2 + y^2), atan2(x,y) + 7*pi )
. . . . . .
Examples of plotting f(r,t) = 0:
m=8, n=6, k=5:
Plot f0(x,y) = 0, g0(x,y) = 0.
m=8, n=6, k=2.5:
Plot f0(x,y) = 0, f1(x,y) = 0, g0(x,y) = 0, g1(x,y) = 0.
m=8, n=6, k=1.25:
Plot f0(x,y) = 0, f1(x,y) = 0, f2(x,y) = 0, f3(x,y)=0,
and g0(x,y) = 0, g1(x,y) = 0, g2(x,y) = 0, g3(x,y) = 0.
Last edited by benice (2011-07-08 21:52:25)
Offline
#12 2011-07-08 22:08:37
- bobbym
- bumpkin
- From: Bumpkinland
- Registered: 2009-04-12
- Posts: 109,606
Re: Graphing implicit polar equation?
Hi;
I have some questions for later on your last post but for now would you plot this on your grapher.
In mathematics, you don't understand things. You just get used to them.
If it ain't broke, fix it until it is.
Always satisfy the Prime Directive of getting the right answer above all else.
Offline
#14 2011-07-09 04:36:25
- bobbym
- bumpkin
- From: Bumpkinland
- Registered: 2009-04-12
- Posts: 109,606
Re: Graphing implicit polar equation?
Hi;
Regarding your post #11. It looks like you are already changing from polar to rectagular, which is what I am doing.
Why do you need all those equations. Mine is one equation. Why did you choose the atan2 command?
In mathematics, you don't understand things. You just get used to them.
If it ain't broke, fix it until it is.
Always satisfy the Prime Directive of getting the right answer above all else.
Offline
#15 2011-07-09 11:49:41
Re: Graphing implicit polar equation?
Why do you need all those equations. Mine is one equation.
Because the polar coordinate representation of a given point in the plane is not unique:
(r, t) = (r, t ± 2n*pi) = (-r, t ± (2n+1)*pi), where n is any integer.
I define f0, f1, f2, ... for (r, t ± 2n*pi) and g0, g1, g2, ... for (-r, t ± (2n+1)*pi).
Why did you choose the atan2 command?
My idea came from this page. (See the section on 'Converting between polar and Cartesian coordinates'.)
Offline
#16 2011-07-09 12:28:12
- bobbym
- bumpkin
- From: Bumpkinland
- Registered: 2009-04-12
- Posts: 109,606
Re: Graphing implicit polar equation?
Hi benice;
Thanks for your patience. I did not think about the lack of uniqueness with the polar coordinates although it seems obvious now. But since you are using atan2 already why not restrict the interval you are graphing to be [ - π / 2 , π/2 ] instead of [-2,2]? Then the problem on non uniqueness disappears.
Let's say you can not do that, then are you saying that you graph all those functions for each drawing?
In mathematics, you don't understand things. You just get used to them.
If it ain't broke, fix it until it is.
Always satisfy the Prime Directive of getting the right answer above all else.
Offline
#17 2011-07-09 16:17:00
Re: Graphing implicit polar equation?
Hi bobbym,
Thanks again for your reply.
Let's say you can not do that, ...
Yes, I can't do that. Graph 4.3 does not support script. It plots equations of the type F(x,y) = 0 with variables x and y (not r and t).
... , then are you saying that you graph all those functions for each drawing?
I graph those functions one at a time.
Please see the attached images plot_1.png ~ plot_4.png for the case m=8, n=6 and k=2.5.
The image plot_5.png shows that the graph of f2(x,y)=0 coincides with the graph of f0(x,y)=0.
There is thus no need to plot f2, f3, ... and g2, g3, ... .
Last edited by benice (2011-07-09 16:26:13)
Offline
#18 2011-07-09 16:29:52
- bobbym
- bumpkin
- From: Bumpkinland
- Registered: 2009-04-12
- Posts: 109,606
Re: Graphing implicit polar equation?
Hi;
Okay, let me look at what you have shown me.
In the assignment here:
f3(x,y) = f( sqrt(x^2 + y^2), atan2(x,y) + 6*pi )
What is f(...) equal to?
In mathematics, you don't understand things. You just get used to them.
If it ain't broke, fix it until it is.
Always satisfy the Prime Directive of getting the right answer above all else.
Offline
#19 2011-07-10 20:47:35
- gAr
- Member

- Registered: 2011-01-09
- Posts: 3,482
Re: Graphing implicit polar equation?
Hi benice,
For the equations in #5, did you edit the image for k=5?
I'm not getting a symmetry like that.
Here are the images I plotted using sagemath.
Update: I used atan() command there, for atan2() I get the same as yours.(3rd and 5th images)
1st image is for k = 3/128.
All of them took almost the same time (about 9.35s, using atan2() command)
Using atan() command is a lot quicker and incorrect!
Last edited by gAr (2011-07-10 23:12:03)
"Believe nothing, no matter where you read it, or who said it, no matter if I have said it, unless it agrees with your own reason and your own common sense" - Buddha?
"Data! Data! Data!" he cried impatiently. "I can't make bricks without clay."
Offline
#20 2011-07-11 20:31:43
Re: Graphing implicit polar equation?
In the assignment here:
f3(x,y) = f( sqrt(x^2 + y^2), atan2(x,y) + 6*pi )
What is f(...) equal to?
-π < atan2(x,y) <= π
5π < atan2(x,y) + 6π <= 7π
The set of polar coordinates A = { (r,t) | f(r,t) = 0 , r∈[0,∞) , t∈(5π,7π] }
is transformed to the set of rectangular coordinates B = { (x,y) | f3(x,y) = 0, x∈R, y∈R }.
That is, A and B represent the same figure (curve) in the plane.
Offline
#22 2011-07-11 20:45:09
- gAr
- Member
- Registered: 2011-01-09
- Posts: 3,482
Re: Graphing implicit polar equation?
Hi benice,
Yes, sagemath uses matplotlib.
http://wiki.sagemath.org/plot
But I have not tried matplotlib separately.
"Believe nothing, no matter where you read it, or who said it, no matter if I have said it, unless it agrees with your own reason and your own common sense" - Buddha?
"Data! Data! Data!" he cried impatiently. "I can't make bricks without clay."
Offline
#23 2011-07-11 21:24:56
Re: Graphing implicit polar equation?
Yes, sagemath uses matplotlib.
http://wiki.sagemath.org/plot.
Thanks for the link!
Offline
#24 2011-07-11 21:30:50
- gAr
- Member
- Registered: 2011-01-09
- Posts: 3,482
Re: Graphing implicit polar equation?
Hi benice,
Since sage doesn't have a windows installer,
someone has created a livecd: https://groups.google.com/group/sage-de … 709f252bf6
Matplotlib is very capable, but got some learning curve.
"Believe nothing, no matter where you read it, or who said it, no matter if I have said it, unless it agrees with your own reason and your own common sense" - Buddha?
"Data! Data! Data!" he cried impatiently. "I can't make bricks without clay."
Offline
Pages: 1