Math Is Fun Forum
You are not logged in.
- Topics: Active | Unanswered
#101 Re: Help Me ! » Graphing implicit polar equation? » 2011-07-08 16:55:16
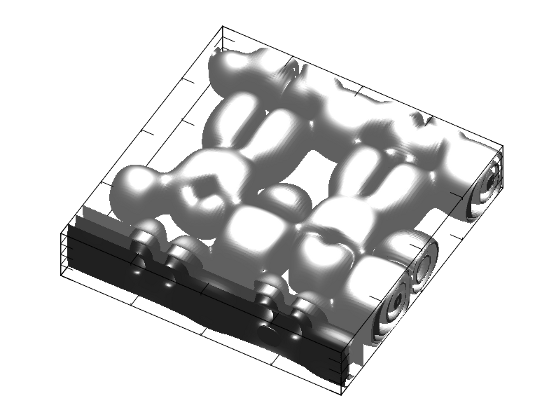
The strange thing is your two graphs seem backwards. The bottom one is for m=8, n=6, k=5. And the top one is for m=8, n=6, k=6.
Sorry! The equation should be
f(r,t) = sin(mr)*cos(nt - pi) + (3/4)*cos(kt - pi/2) - r³ + 3r - 3/4,
not
f(r,t) = sin(mr)*cos(nt - pi) - (3/4)*cos(kt - pi/2) - r³ + 3r - 3/4.
#102 Re: Help Me ! » Graphing implicit polar equation? » 2011-07-08 10:38:01
Hi bobbym,
I use the interval [-2,2] for both x and y, not for r and t.
#103 Re: Help Me ! » Dense and separable » 2011-07-06 21:41:32
I think setting up an uncountable and disjoint collection of subset, and then
For each t in [a,b] define the function f_t on [a,b] by
f_t(x) = 1 if x=t and 0 elsewhere.
Consider the set of functions { f_t | t ∈ [a,b] }.
#104 Re: Help Me ! » Graphing implicit polar equation? » 2011-07-06 21:19:33
Hi bobbym,
Thanks for your kind reply!
Below is an example function
f(r,t) = sin(mr)*cos(nt - pi) - (3/4)*cos(kt - pi/2) - r³ + 3r - 3/4.
The plotter I use to experiment is Graph 4.3. It transforms the coordinates and then
plots implicit rectangular equations. The plotter works fine if n, k are integers or
rational numbers with small denominators.
The plotting speed is very slow if n, k are irrational numbers or rational numbers
with large denominators (e.g. k = 3/128). And this is why I am looking for a plotter
which can plot implicit polar equations directly and quickly.
m=8, n=6, k=5: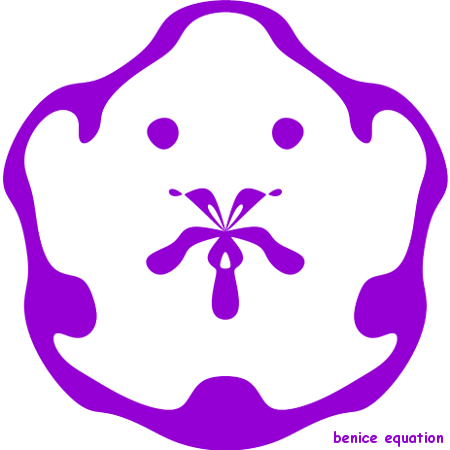
m=8, n=6, k=6: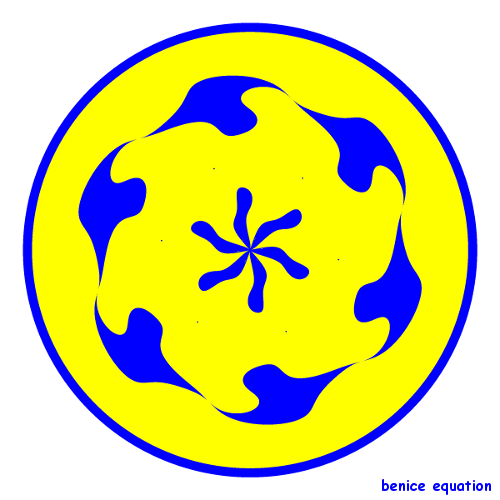
#105 Re: Help Me ! » Graphing implicit polar equation? » 2011-07-05 11:43:19
Hi bobbym,
Thanks for your reply!
Please see the Equation Grapher examples with x & y replaced by r & t.
My purpose is to make art with implicit polar equations, not to solve a specific math problem.
It is better if the software can also plot inequalities of the following types:
f(r,t) > 0, f(r,t) >= 0, f(r,t) < 0, f(r,t) <= 0.
Someone recommended me Mathematica. But it's too expensive!.
#106 Help Me ! » Graphing implicit polar equation? » 2011-07-04 16:48:25
- benice
- Replies: 23
Hi All,
Could you please tell me what software can plot implicit polar equations?
Thanks!
#107 Re: This is Cool » [Funny Math Art] Guess what's inside? » 2011-06-17 13:00:35
#108 Re: This is Cool » [Funny Math Art] Guess what's inside? » 2011-02-26 18:42:07
Hi gAr,
Yes, those are all my posts. Thank you for giving this subject your attention.
(Three different cross sections of the surface)
#109 Re: This is Cool » [Funny Math Art] Guess what's inside? » 2011-02-16 07:41:53
Is it a pinball machine?
Maybe we can build a pinball machine which looks like these animations:
#110 Re: This is Cool » [Funny Math Art] Guess what's inside? » 2011-02-06 03:49:55
Hint:
Consider the intersection of a horizontal plane with the surface.
The intersection consists of a family of funny curves.
(An example curve is shown below. It has nothing to do with the answer.)
Cut off the upper surface above the horizontal plane
to get a funny 3D image.

(This curve is obtained from another surface.)
#111 This is Cool » [Funny Math Art] Guess what's inside? » 2011-02-03 17:00:11
- benice
- Replies: 8
The surface in above image is a portion of the graph of
some mathematical equation.
Let's do some brainstorming:
Can you guess what's inside the surface?
Answers:
A funny 3D image: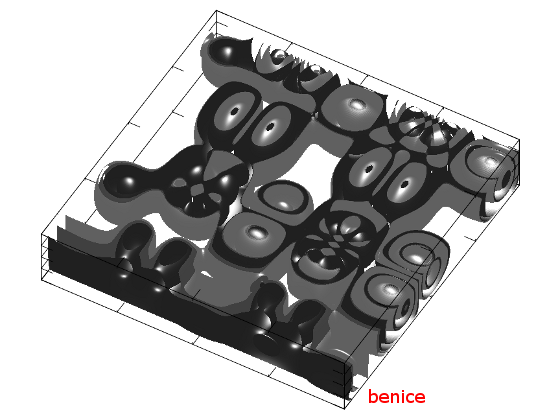
A funny curve: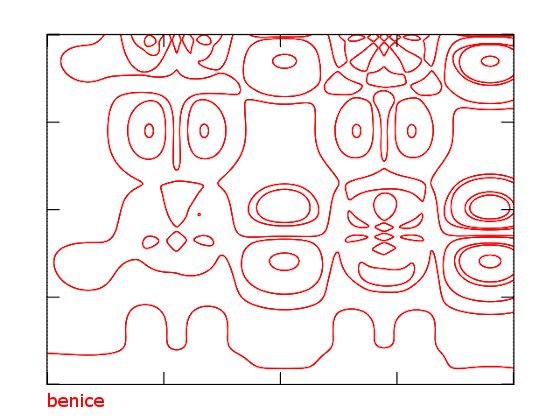
The above graphics were created completely using math formulas and math softwares.
#112 Re: Help Me ! » The funniest equation graph? » 2010-12-22 02:57:58
Hi benice;
Is your avatar an equation? Which one?
It's the graph of the following inequality:
[(x-1)^2 + y^2 - 4] [(x+1)^2 + y^2 - 4] [x^2 + (y - sqrt(3))^2 - 4] < c
c = 1, 12, 6
#113 Re: Help Me ! » The funniest equation graph? » 2010-12-21 14:32:45
Hi bobbym,
Thanks for your reply.
What I am looking for are amusing equation graphs that will make me laugh.
But there are no such graphs on the pages you mentioned above.
Anyway, thanks a lot for your effort.
#114 Help Me ! » The funniest equation graph? » 2010-12-21 09:14:53
- benice
- Replies: 6
Hi everyone!
What is the world's funniest equation graph?
What is the funniest equation graph you have ever seen?
Here the equation should be as simple as possible.
And it can't be expressed as the product of two equations.
Thanks.
benice