Math Is Fun Forum
You are not logged in.
- Topics: Active | Unanswered
#76 Re: This is Cool » A drunken star is dancing! » 2011-10-09 06:42:44
Hi;
I just noticed that I could right click those images and save them as an animated .gif!
They are GIF animations, not Flash animations.
#77 Re: This is Cool » A drunken star is dancing! » 2011-10-09 06:31:56
Hi bob bundy;
Thank you for watching and have a nice day!
#78 Re: This is Cool » A drunken star is dancing! » 2011-10-09 06:29:59
Very good! More! More! More!
Hi bobbym;
Thank you for your appreciation.
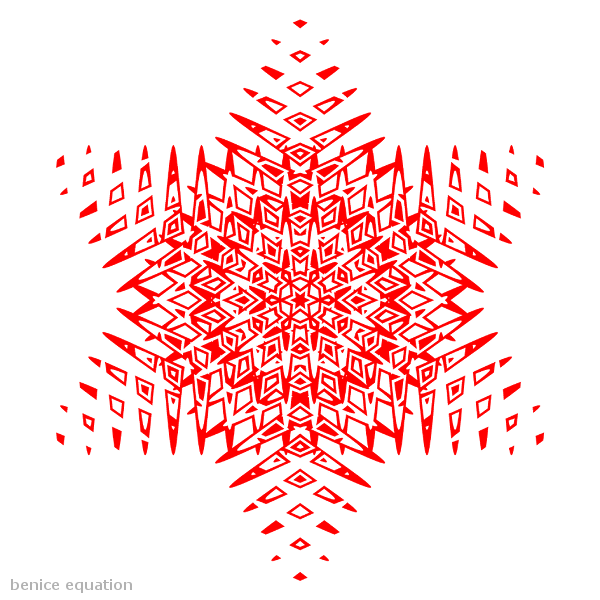
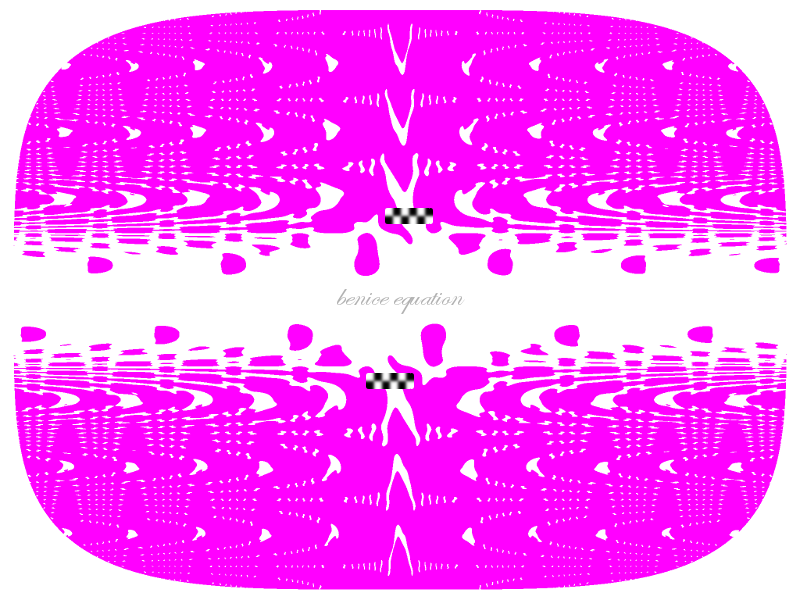
Six-pointed stars:
Sine Star (3)
Cosine Star (3)
#79 This is Cool » A drunken star is dancing! » 2011-10-05 10:56:53
- benice
- Replies: 7
Sine Star (1)
(Please click on the link for more information.)
Cosine Star (1)
(Please click on the link for more information.)
Sine Star (2)
(Click on the link to see more pictures.)

Cosine Star (2)
(Click on the link to see more pictures.)
Six-pointed stars:
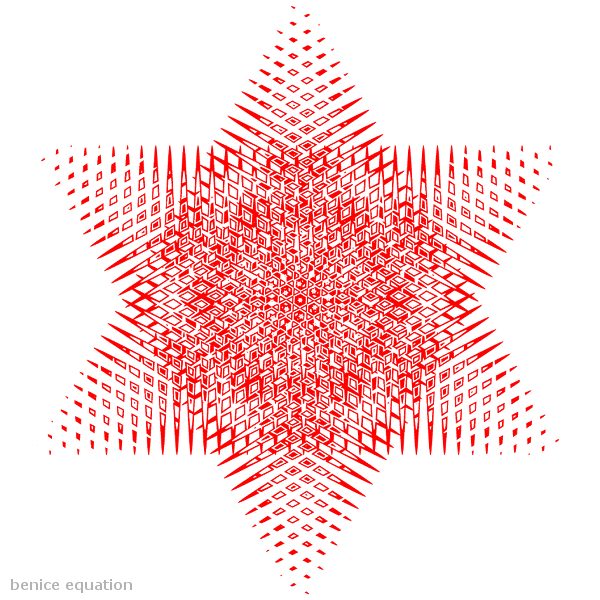
Sine Star (3)
(Click on the link to see more pictures.)
Cosine Star (3)
(Click on the link to see more pictures.)
#80 Re: This is Cool » How to draw the US Flag mathematically? » 2011-09-20 15:15:39
Hi All!
A five-pointed star (☆) can be obtained by drawing five lines.
Based on this, I made an animation by drawing five collections
of parallel lines: Starflakes Animation
#81 Re: This is Cool » How to draw the US Flag mathematically? » 2011-09-20 15:11:32
Hi;
The little mouse is my favorite I think.
Hi;
Thank you for your appreciation.
#82 Re: This is Cool » How to draw the US Flag mathematically? » 2011-09-13 18:42:35
Hi bobbym,
Thank you! And you're welcome.
#83 Re: This is Cool » How to draw the US Flag mathematically? » 2011-09-13 18:39:53
Hi MathsIsFun,
Thank you for your appreciation.
The following image is the original graph (of inequality) of the first picture in the post "Monster Cow".

#84 This is Cool » How to draw the US Flag mathematically? » 2011-09-12 18:41:31
- benice
- Replies: 21
Hi Everyone!
I don't know if this is cool or not: Drawing a US Flag using Inequalities.
It's really a practical application of mathematics.
#85 Re: This is Cool » Iterations!!! » 2011-09-08 20:25:16
if you know anything about any iteration/iterations post it here.
The Antlerman Sequence
#86 Re: This is Cool » Cool Function » 2011-08-29 10:04:26
Hey benice,
Wow! What programme did you use?
UDAV (universal data array visualization)
It's free!
#87 Re: This is Cool » Fractals in html5 » 2011-08-29 09:56:25
Have you seen the example here, using numpy and matplotlib : http://mentat.za.net/numpy/intro/intro.html
Thanks again for the link, gAr! I've bookmarked that page.
#88 Re: This is Cool » Cool Function » 2011-08-28 09:31:32
Hi;
Looks like a hamburger! A delicious one!
Hi,
The boundary curve is a superellipse: (x/4)^4 + (y/3)^4 = 1.
#89 Re: This is Cool » Cool Function » 2011-08-28 08:50:54
I've found a cool function: -|x|^(-|x|)
Hi pisquared,
You are so sick! Me too!
#90 Re: This is Cool » Fractals in html5 » 2011-08-28 08:43:09
Hi gAr,
Thanks for the link! I noticed the Buddha's quote in your signature.
Have you seen the Buddhabrot? It's amazing!
#91 Re: Maths Is Fun - Suggestions and Comments » (Bug Report) Equation Grapher gives wrong graphs » 2011-08-11 14:33:21
#92 Re: Maths Is Fun - Suggestions and Comments » (Bug Report) Equation Grapher gives wrong graphs » 2011-08-11 14:13:47
Hi bobbym,
I agree with you. It's difficult to write a contour plotter from scratch.
Many thanks to those kind people who make open/free plotters for us.
#93 Maths Is Fun - Suggestions and Comments » (Bug Report) Equation Grapher gives wrong graphs » 2011-08-10 16:11:26
- benice
- Replies: 6
Hi,
The MathsIsFun Equation Grapher gives wrong graph for
(abs(x-1) + abs(y) - 1) * (abs(x) + abs(y-1) - 1) = 0.
#94 Re: Help Me ! » Graphing implicit polar equation? » 2011-07-11 21:24:56
Yes, sagemath uses matplotlib.
http://wiki.sagemath.org/plot.
Thanks for the link!
#95 Re: Help Me ! » Graphing implicit polar equation? » 2011-07-11 20:39:49
Hi gAr,
Here are the images I plotted using sagemath.
Could you tell me which package did you use to make these images? Is it Matplotlib?
#96 Re: Help Me ! » Graphing implicit polar equation? » 2011-07-11 20:31:43
In the assignment here:
f3(x,y) = f( sqrt(x^2 + y^2), atan2(x,y) + 6*pi )
What is f(...) equal to?
-π < atan2(x,y) <= π
5π < atan2(x,y) + 6π <= 7π
The set of polar coordinates A = { (r,t) | f(r,t) = 0 , r∈[0,∞) , t∈(5π,7π] }
is transformed to the set of rectangular coordinates B = { (x,y) | f3(x,y) = 0, x∈R, y∈R }.
That is, A and B represent the same figure (curve) in the plane.
#97 Re: Help Me ! » Graphing implicit polar equation? » 2011-07-09 16:17:00
Hi bobbym,
Thanks again for your reply.
Let's say you can not do that, ...
Yes, I can't do that. Graph 4.3 does not support script. It plots equations of the type F(x,y) = 0 with variables x and y (not r and t).
... , then are you saying that you graph all those functions for each drawing?
I graph those functions one at a time.
Please see the attached images plot_1.png ~ plot_4.png for the case m=8, n=6 and k=2.5.
The image plot_5.png shows that the graph of f2(x,y)=0 coincides with the graph of f0(x,y)=0.
There is thus no need to plot f2, f3, ... and g2, g3, ... .
#98 Re: Help Me ! » Graphing implicit polar equation? » 2011-07-09 11:49:41
Why do you need all those equations. Mine is one equation.
Because the polar coordinate representation of a given point in the plane is not unique:
(r, t) = (r, t ± 2n*pi) = (-r, t ± (2n+1)*pi), where n is any integer.
I define f0, f1, f2, ... for (r, t ± 2n*pi) and g0, g1, g2, ... for (-r, t ± (2n+1)*pi).
Why did you choose the atan2 command?
My idea came from this page. (See the section on 'Converting between polar and Cartesian coordinates'.)
#99 Re: Help Me ! » Graphing implicit polar equation? » 2011-07-09 00:22:48
Hi bobbym,
-(x^2 + y^2)^(1.5) + 3*sqrt(x^2+y^2) - sin(8*sqrt(x^2+y^2))*cos(6*atan(y/x))
+ 0.75*sin(6*atan(y/x)) - 0.75 = 0
#100 Re: Help Me ! » Graphing implicit polar equation? » 2011-07-08 21:43:48
Hi bobbym,
Here is what I use in the plotting process.
Define the following functions:
f0(x,y) = f( sqrt(x^2 + y^2), atan2(x,y) )
f1(x,y) = f( sqrt(x^2 + y^2), atan2(x,y) + 2*pi )
f2(x,y) = f( sqrt(x^2 + y^2), atan2(x,y) + 4*pi )
f3(x,y) = f( sqrt(x^2 + y^2), atan2(x,y) + 6*pi )
. . . . . .
g0(x,y) = f( -sqrt(x^2 + y^2), atan2(x,y) + pi )
g1(x,y) = f( -sqrt(x^2 + y^2), atan2(x,y) + 3*pi )
g2(x,y) = f( -sqrt(x^2 + y^2), atan2(x,y) + 5*pi )
g3(x,y) = f( -sqrt(x^2 + y^2), atan2(x,y) + 7*pi )
. . . . . .
Examples of plotting f(r,t) = 0:
m=8, n=6, k=5:
Plot f0(x,y) = 0, g0(x,y) = 0.
m=8, n=6, k=2.5:
Plot f0(x,y) = 0, f1(x,y) = 0, g0(x,y) = 0, g1(x,y) = 0.
m=8, n=6, k=1.25:
Plot f0(x,y) = 0, f1(x,y) = 0, f2(x,y) = 0, f3(x,y)=0,
and g0(x,y) = 0, g1(x,y) = 0, g2(x,y) = 0, g3(x,y) = 0.